← Back to portfolio

Enterprise Marketing Analytics Platform

SQL · Python · Tableau · Excel Reporting · Customer Analytics

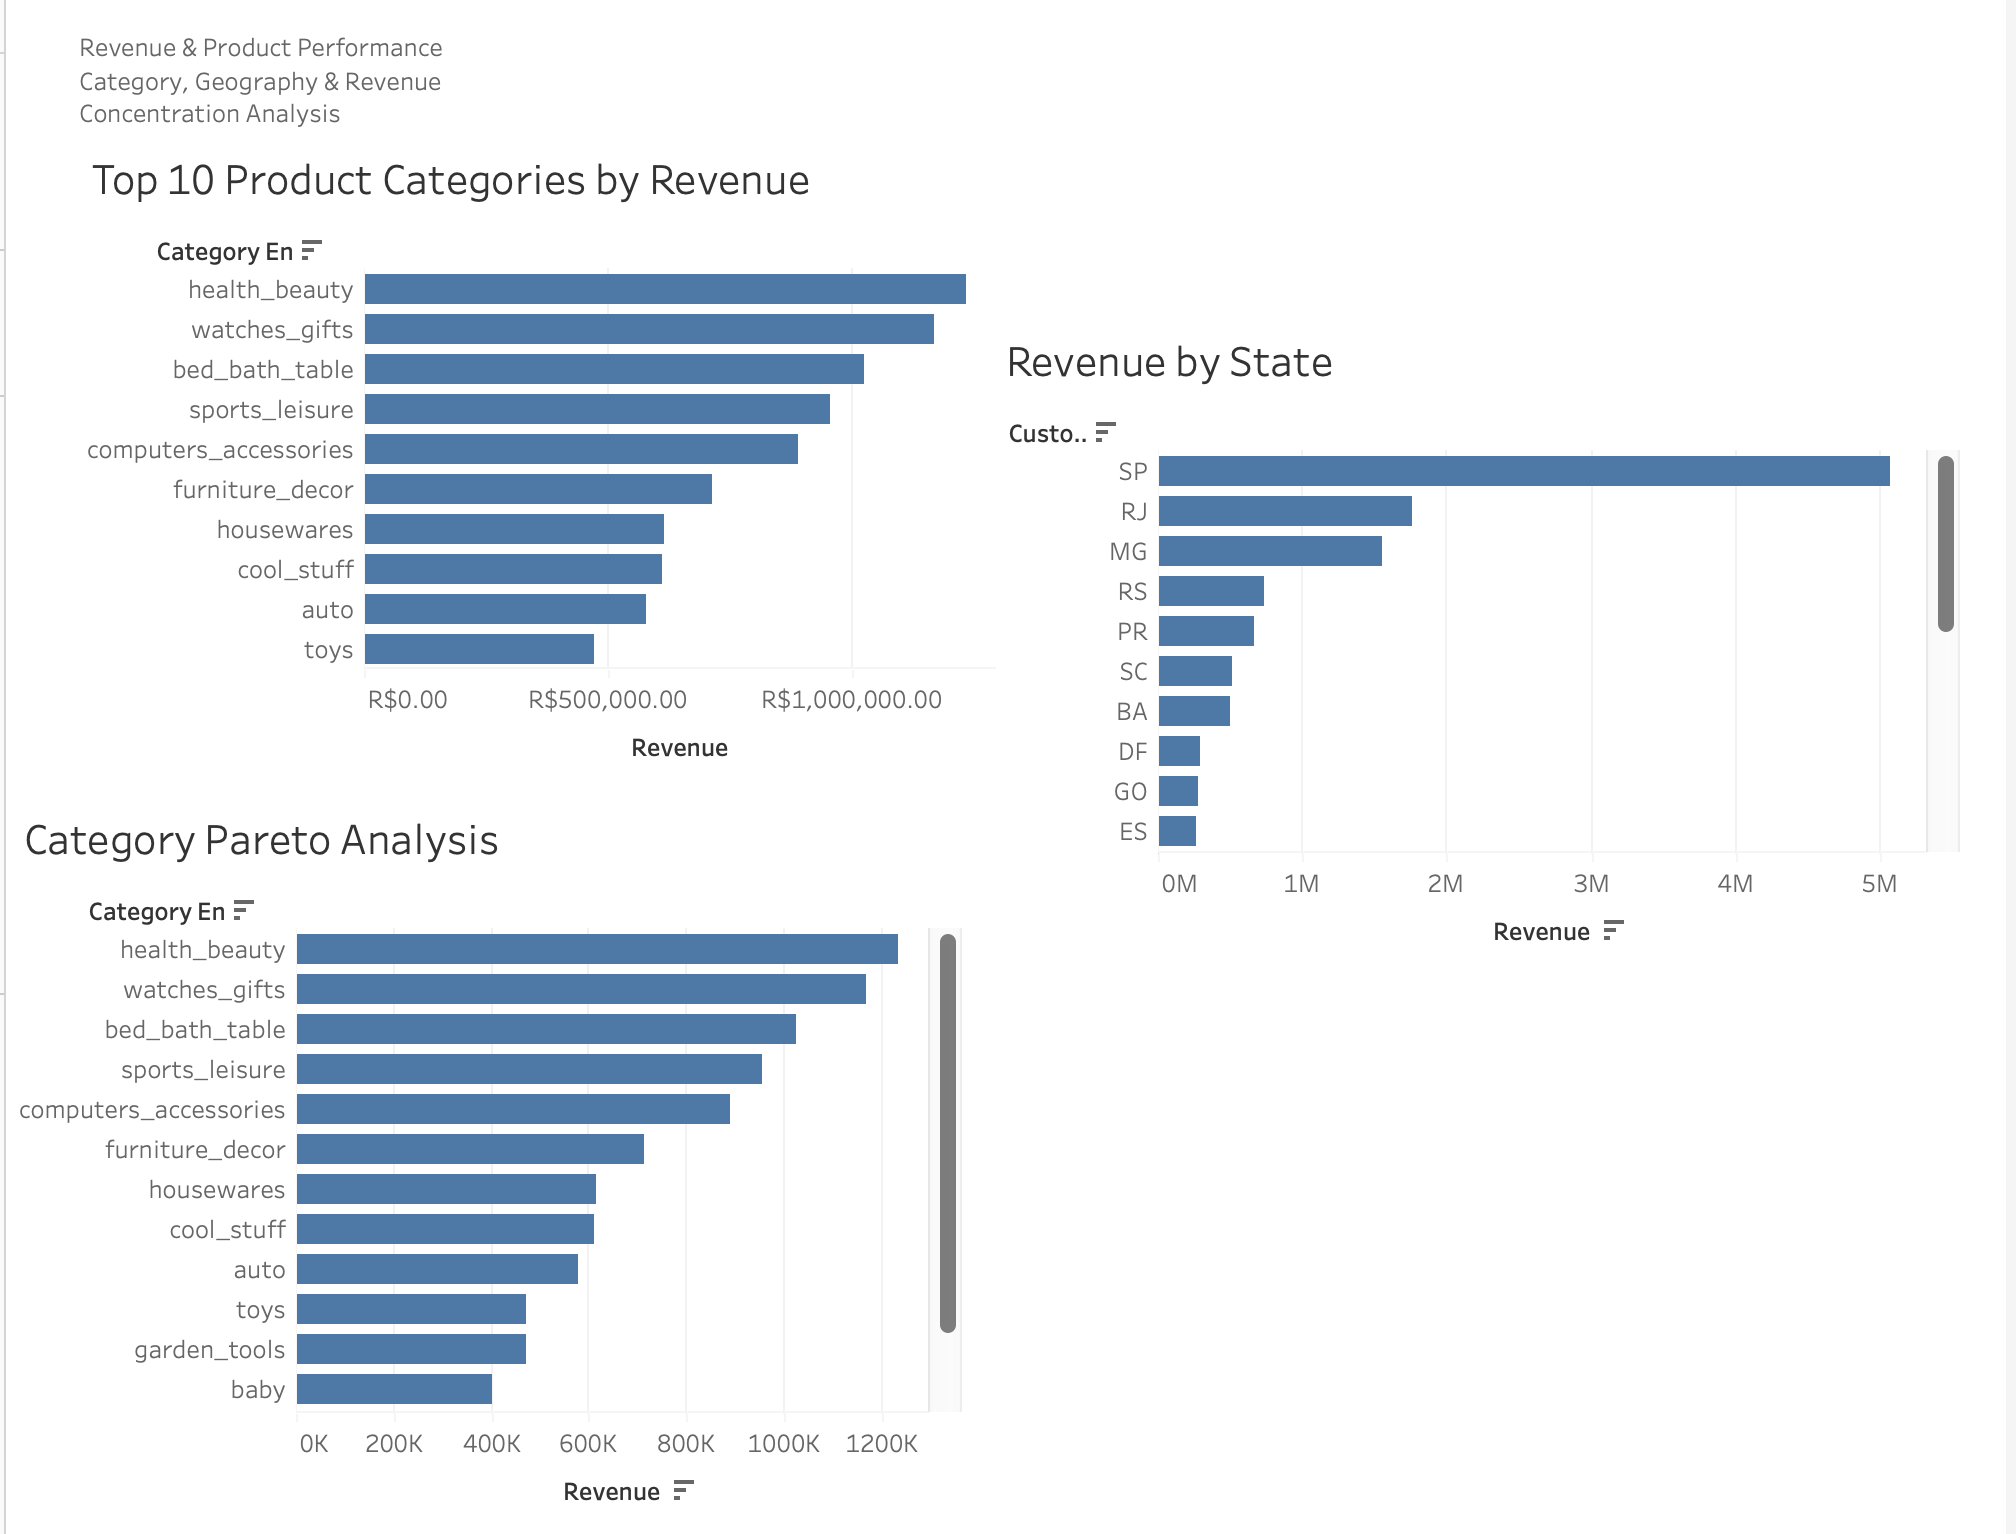
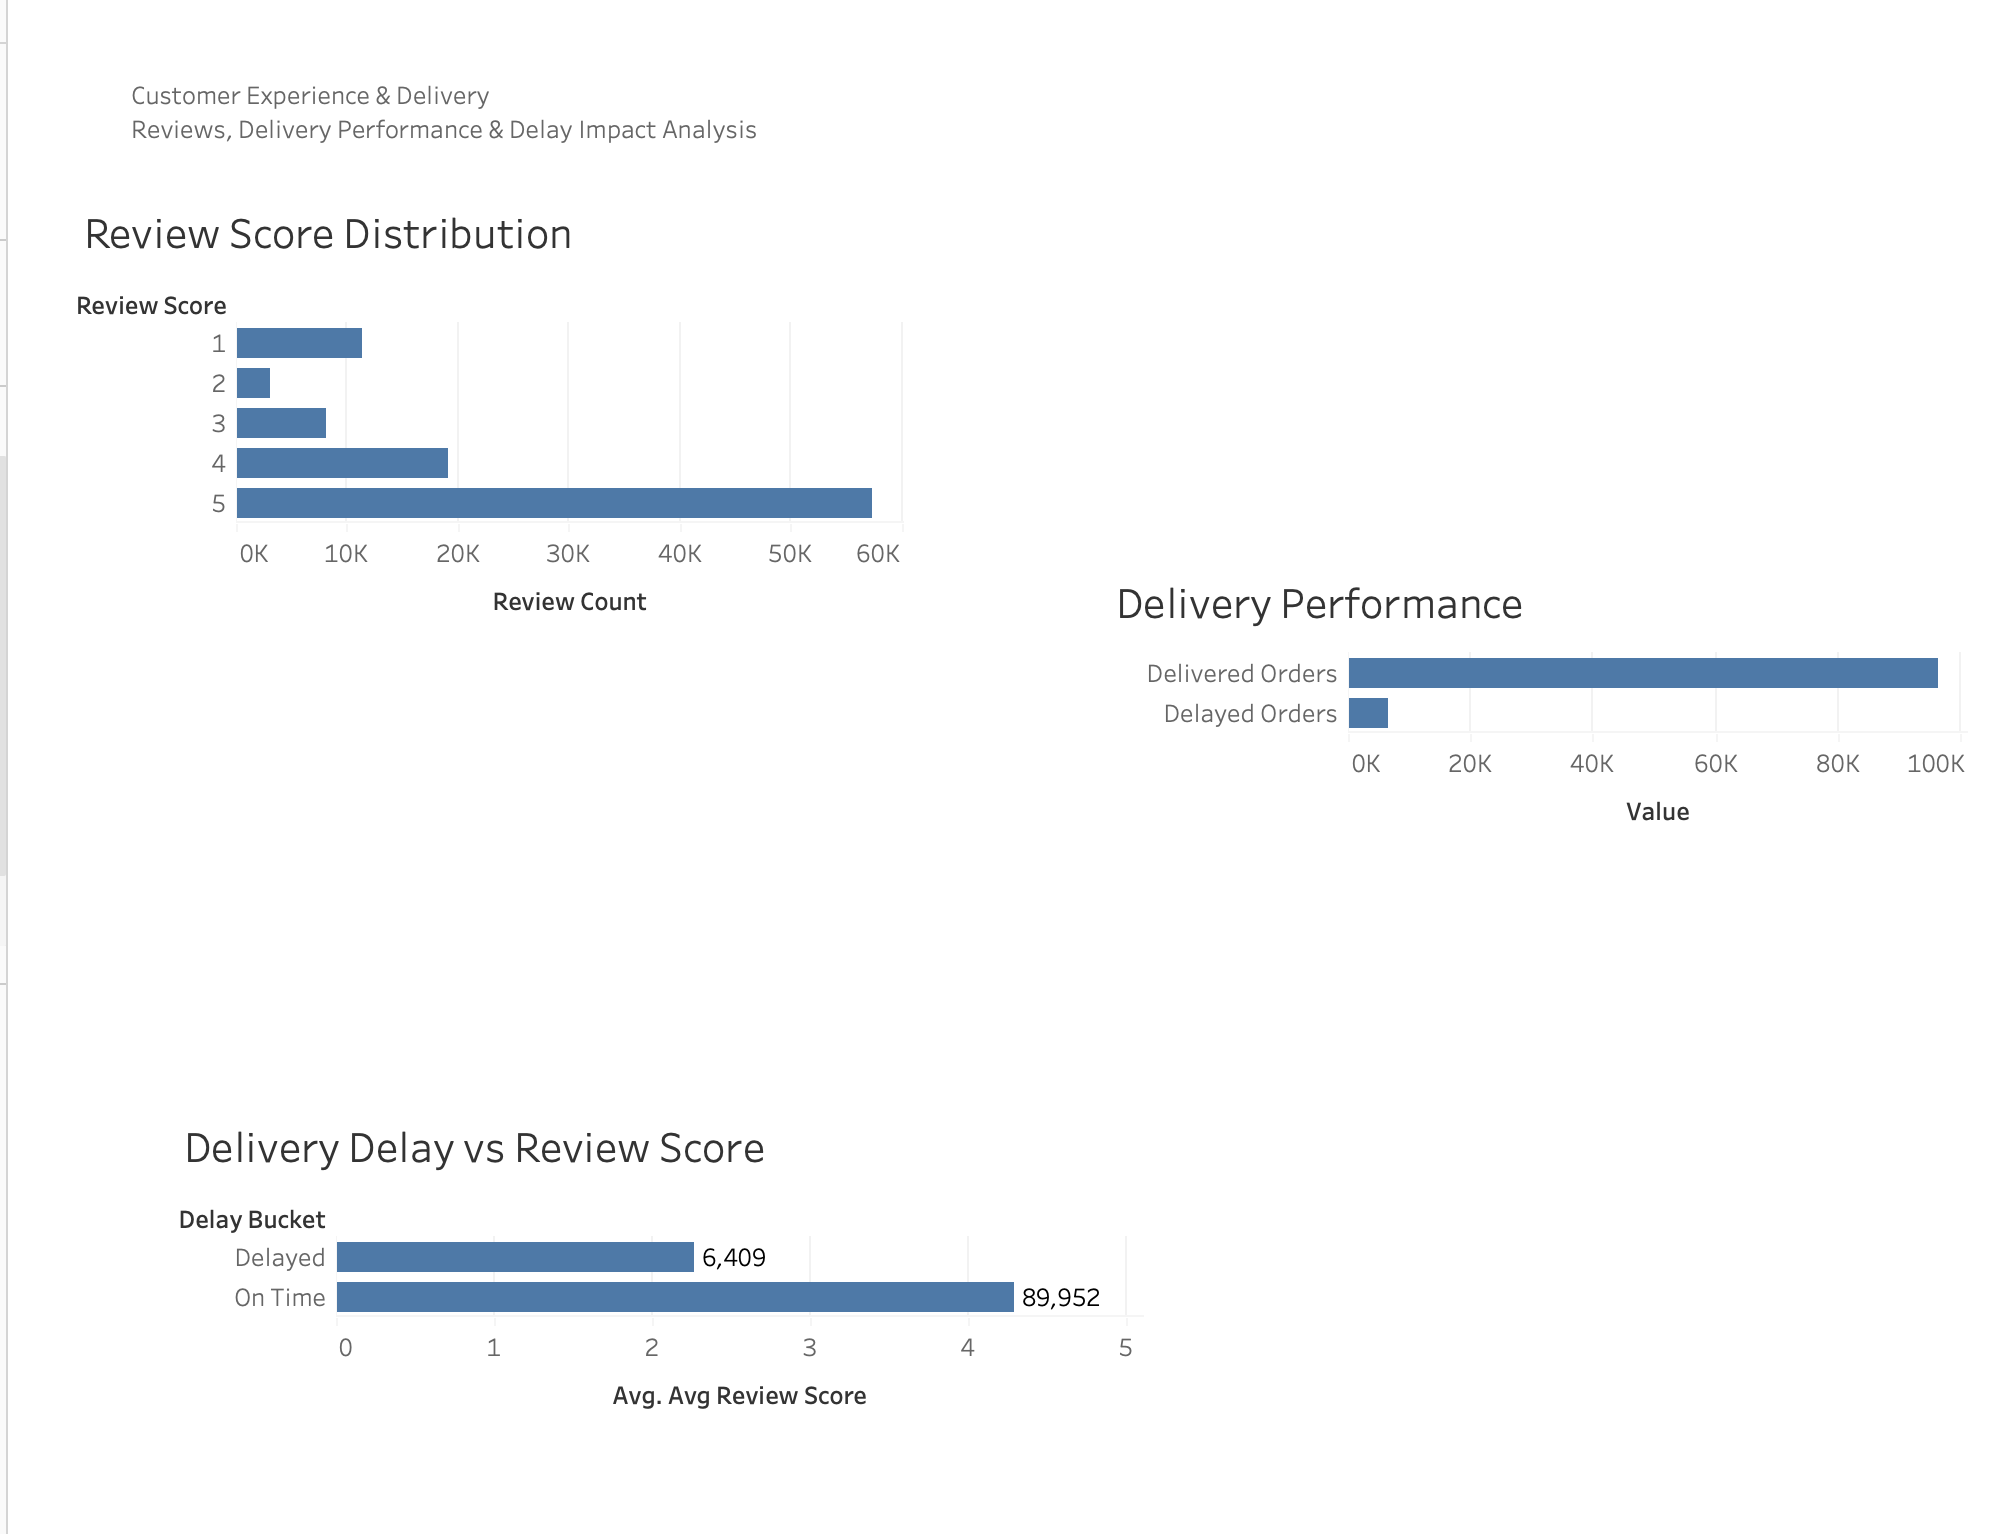
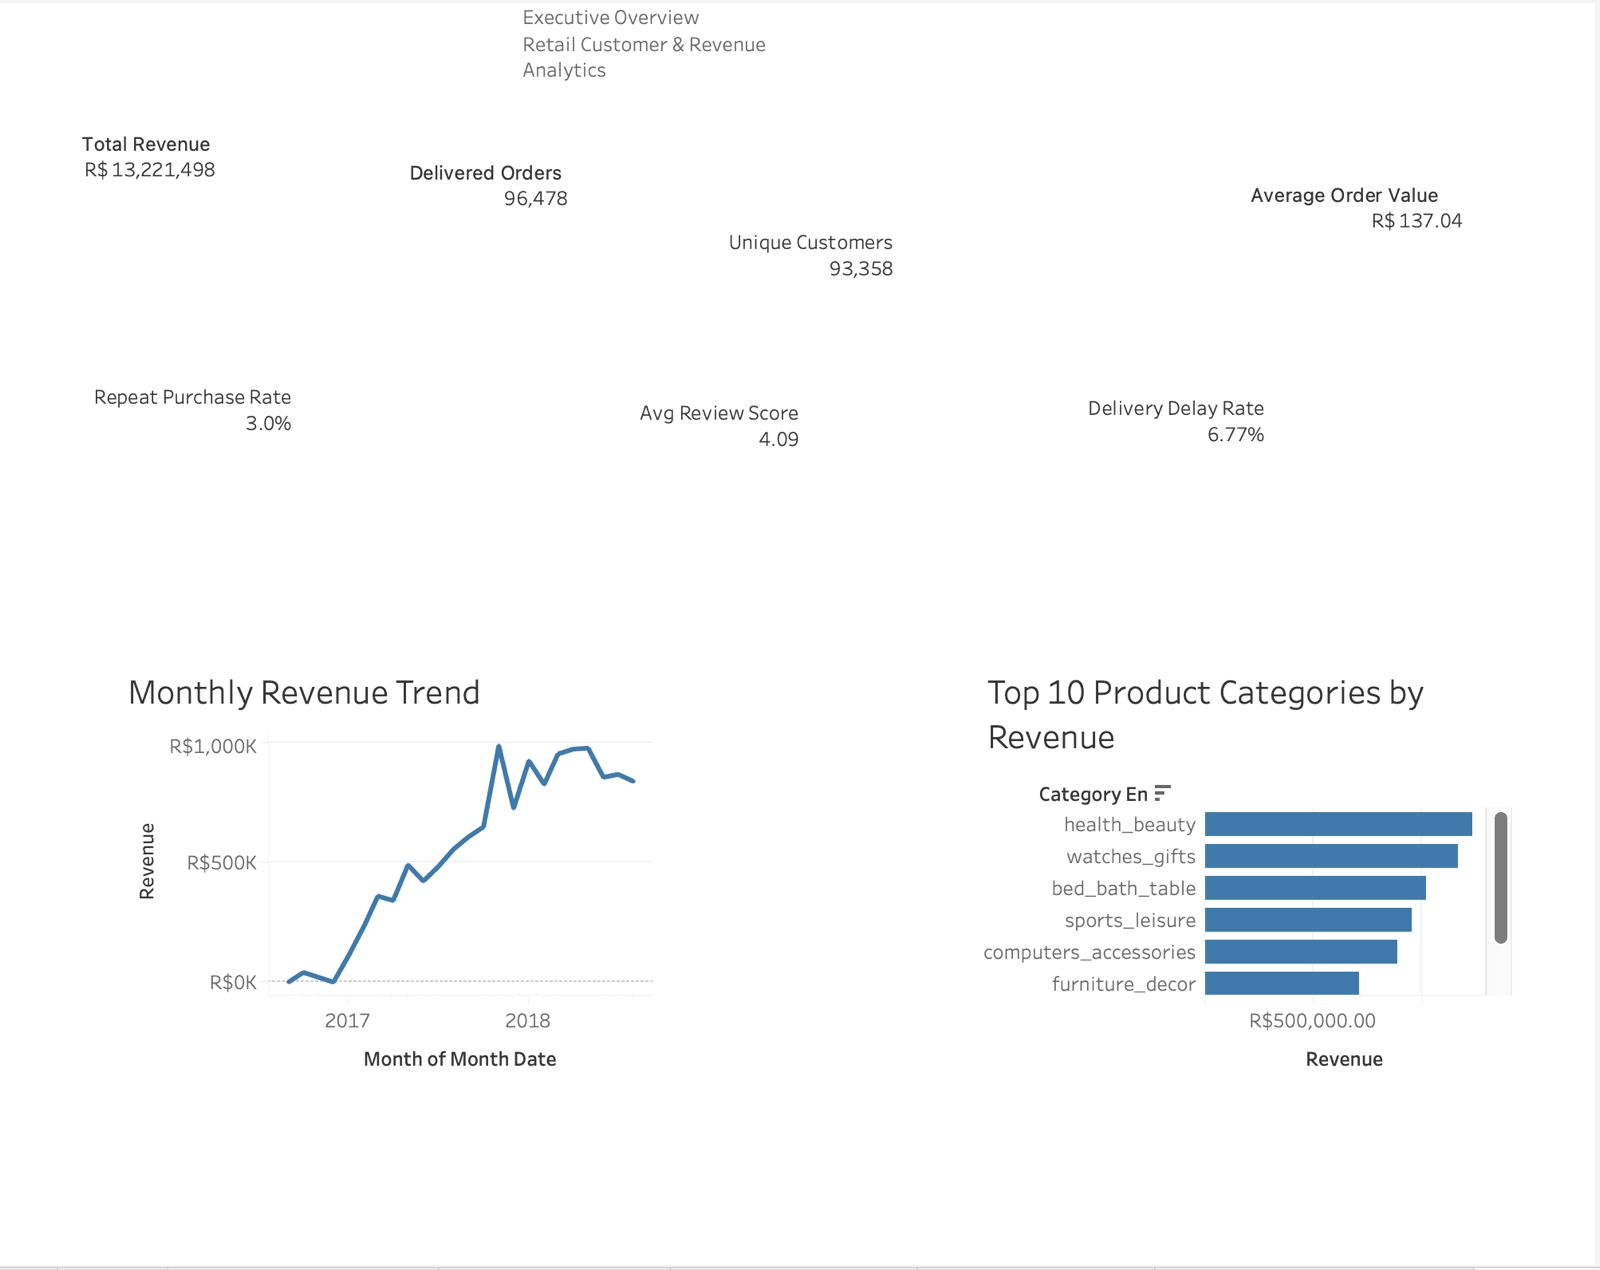
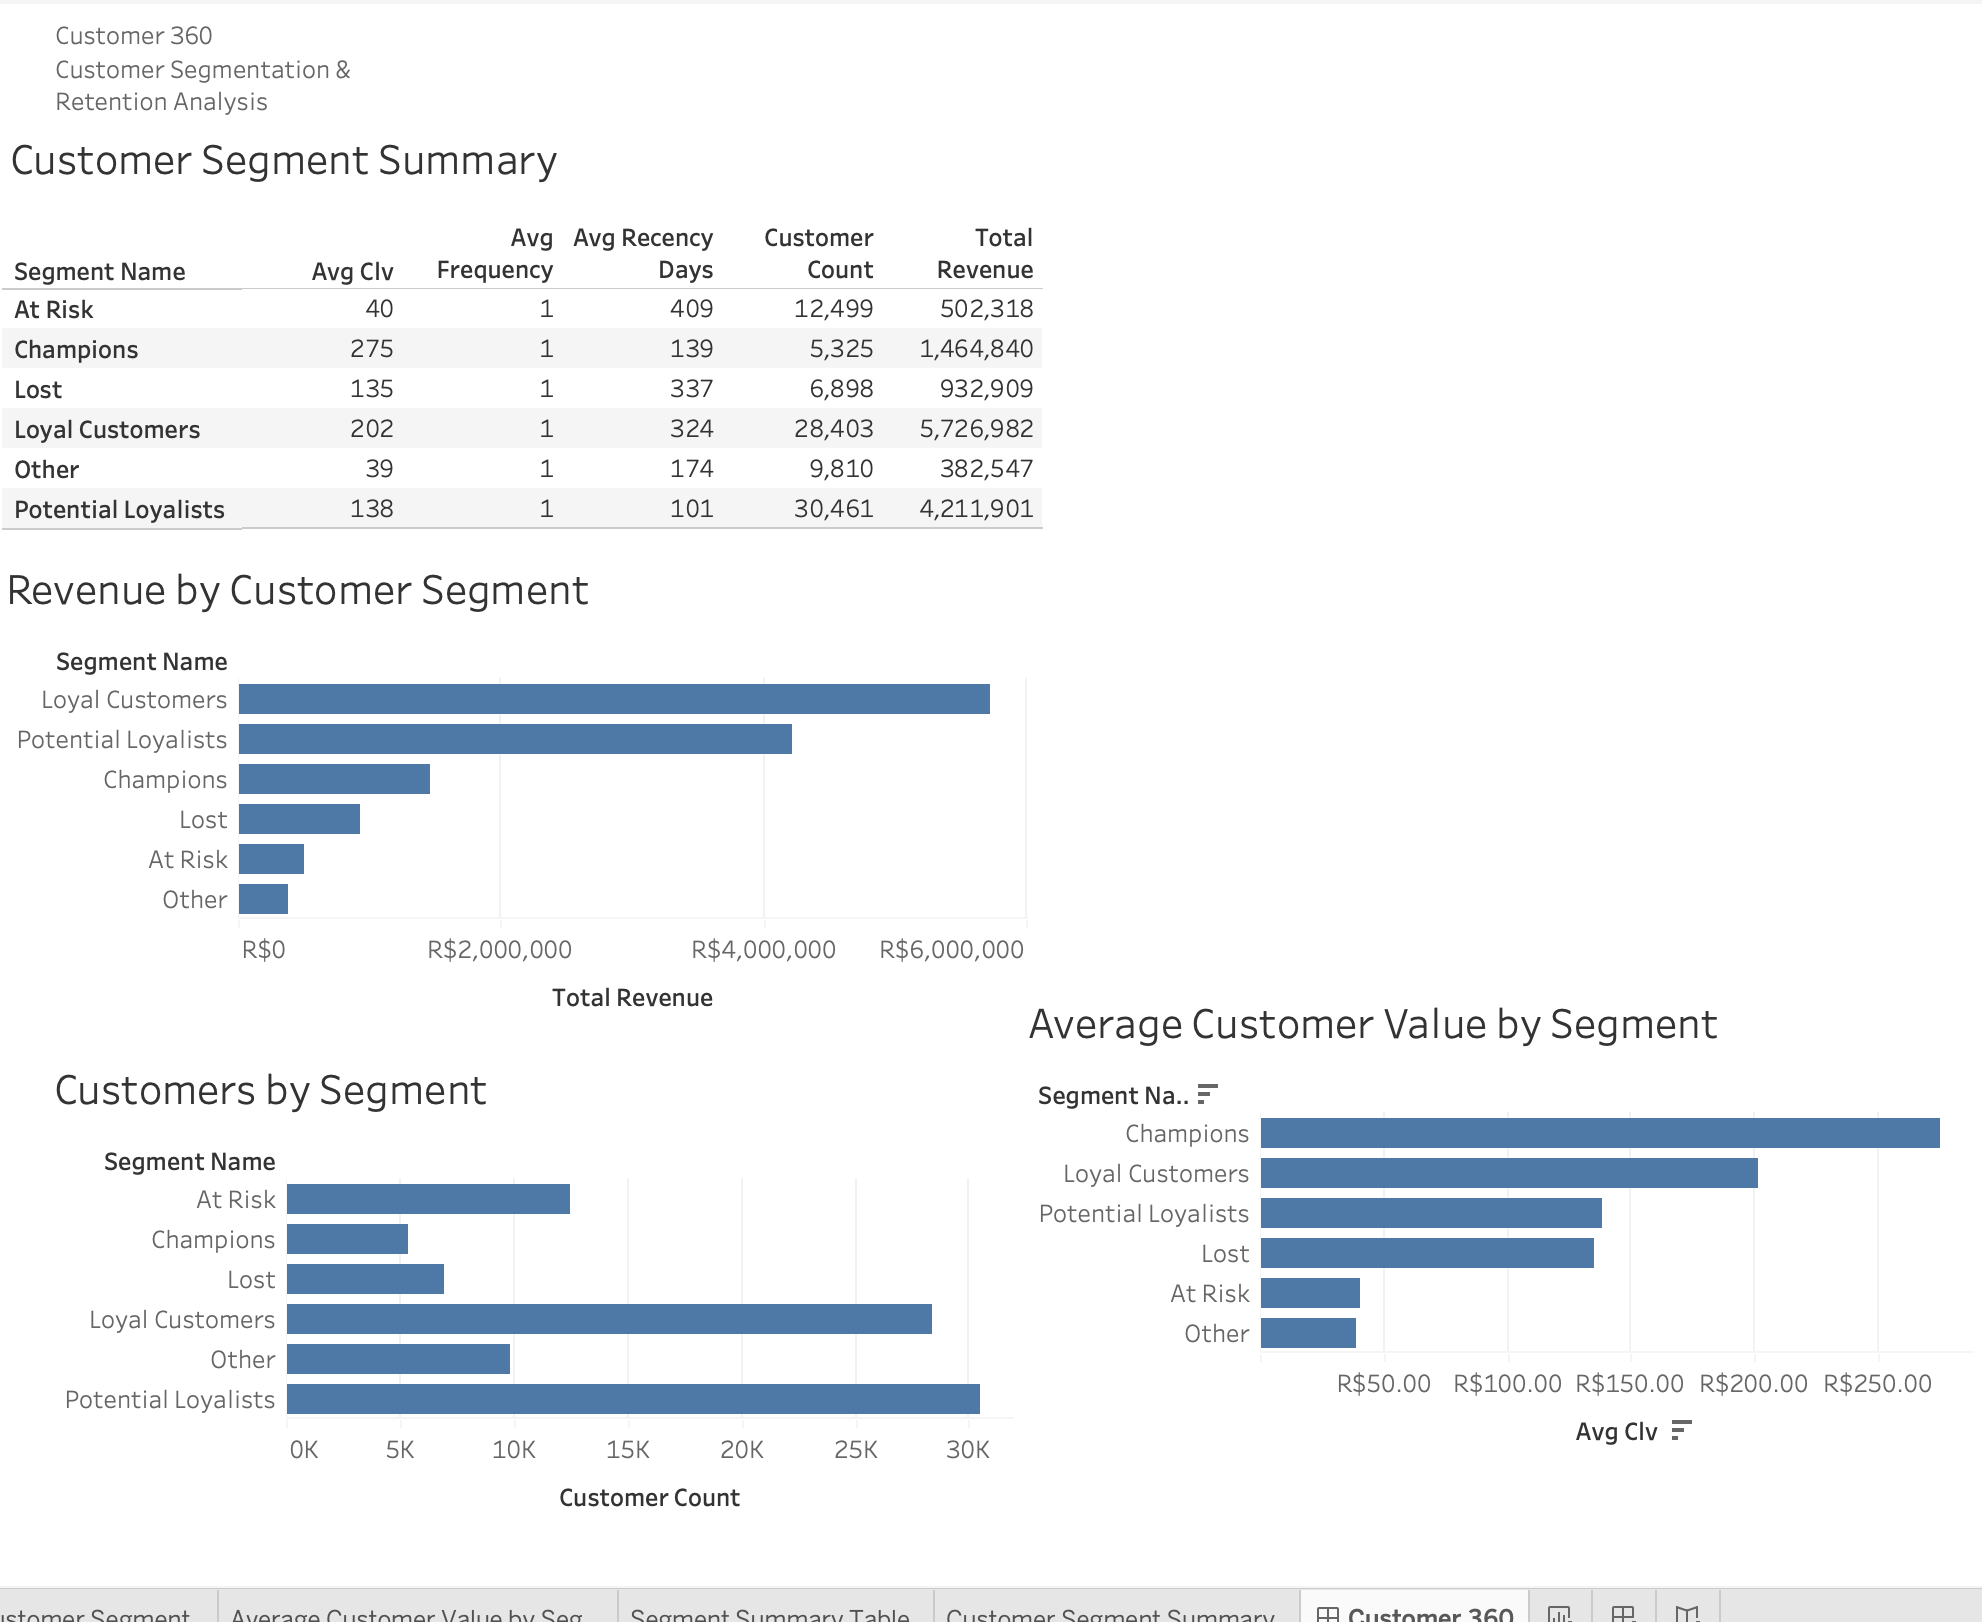
This project includes four Tableau dashboard pages covering executive KPIs, customer segmentation, product/category revenue, and customer experience/delivery performance.

Tools used

PythonSQLDuckDBTableauExcelPandasJupyterGitHub

Key metrics

96,478 Delivered Orders
93,358 Unique Customers
R$13.2M Revenue
R$137.04 Average Order Value
3.0% Repeat Purchase Rate
4.09 Avg Review Score
6.77% Delivery Delay Rate

Business insights

  • Revenue scaled from R$40,325 (Oct 2016) to a peak of R$977,545 (May 2018), showing strong marketplace growth through 2017–2018.
  • Top 5 product categories account for 39.8% of category revenue — health_beauty, watches_gifts, and bed_bath_table lead performance.
  • Only 3.0% of customers placed 2+ delivered orders, highlighting a major retention opportunity across ~97% one-time buyers.
  • Loyal Customers generate the most total revenue (R$5.43M), while Champions have the highest average customer lifetime value (R$273).
  • São Paulo (SP) drives 38.3% of state revenue (R$5.07M), with RJ and MG as the next largest markets.
  • Delayed deliveries average a 2.27 review score vs 4.29 for on-time orders — logistics performance strongly affects customer satisfaction.
Business recommendations

  • Launch win-back campaigns for At Risk customers and a VIP program for Champions to improve retention and lifetime value.
  • Reduce delivery delay rate below 5% with carrier alerts when estimated delivery dates are at risk.
  • Implement post-purchase email flows and loyalty incentives to grow the 3.0% repeat purchase rate.
  • Prioritize merchandising and marketing spend on top-performing categories identified in the Pareto analysis.
  • Optimize logistics and regional marketing in SP, RJ, and MG before expanding investment in lower-volume states.